
The Alphabet Soup of Startup Metrics
-
Have you ever sat through a pitch deck and heard startup founders throw around fancy terms and acronyms when explaining statistics that are hard to grasp?
-
Whether it is TAM, IRR, or CAC, don't worry, WGY - We've Got You!
-
Here is a comprehensive list of some startup metrics that you will come across endlessly during your angel investing journey. Like always, you must definitely consider these when investing in a new venture!
Read on to find out!
“You cannot manage what you cannot measure”
There is much wisdom in this saying. It rings true with the Big Data explosion of the 21st Century. Simply put, because of big data, you can measure, and hence know, radically more about your business and investment, and directly translate that knowledge into improved decision making and performance.
Consider retailing. Booksellers in physical stores could always track which books sold and which did not. If they had a loyalty program, they could tie some of those purchases to individual customers. And that was about it.
Once shopping moved online, though, the understanding of what customers want increased exponentially. Online retailers could track not only what customers bought, but also what else they looked at on the site. They developed algorithms to predict what books individual customers would like to read next—algorithms that performed better every time the customer responded to or ignored a recommendation. It’s no wonder that Amazon put so many brick-and-mortar bookstores out of business.
The familiarity of the Amazon story almost masks its power. But the moral remains - metrics matter and have the potential to make or break a business.
Which brings us to the technical part - As an angel investor what metrics should you keep a track of before & after making an investment? And what key performance indicators (KPIs) are important to understand so you can measure, analyze, and grow your investment portfolio using data, rather than blindly trying to grow.
So we narrowed it down to 10 metrics that you must definitely keep a watch on!
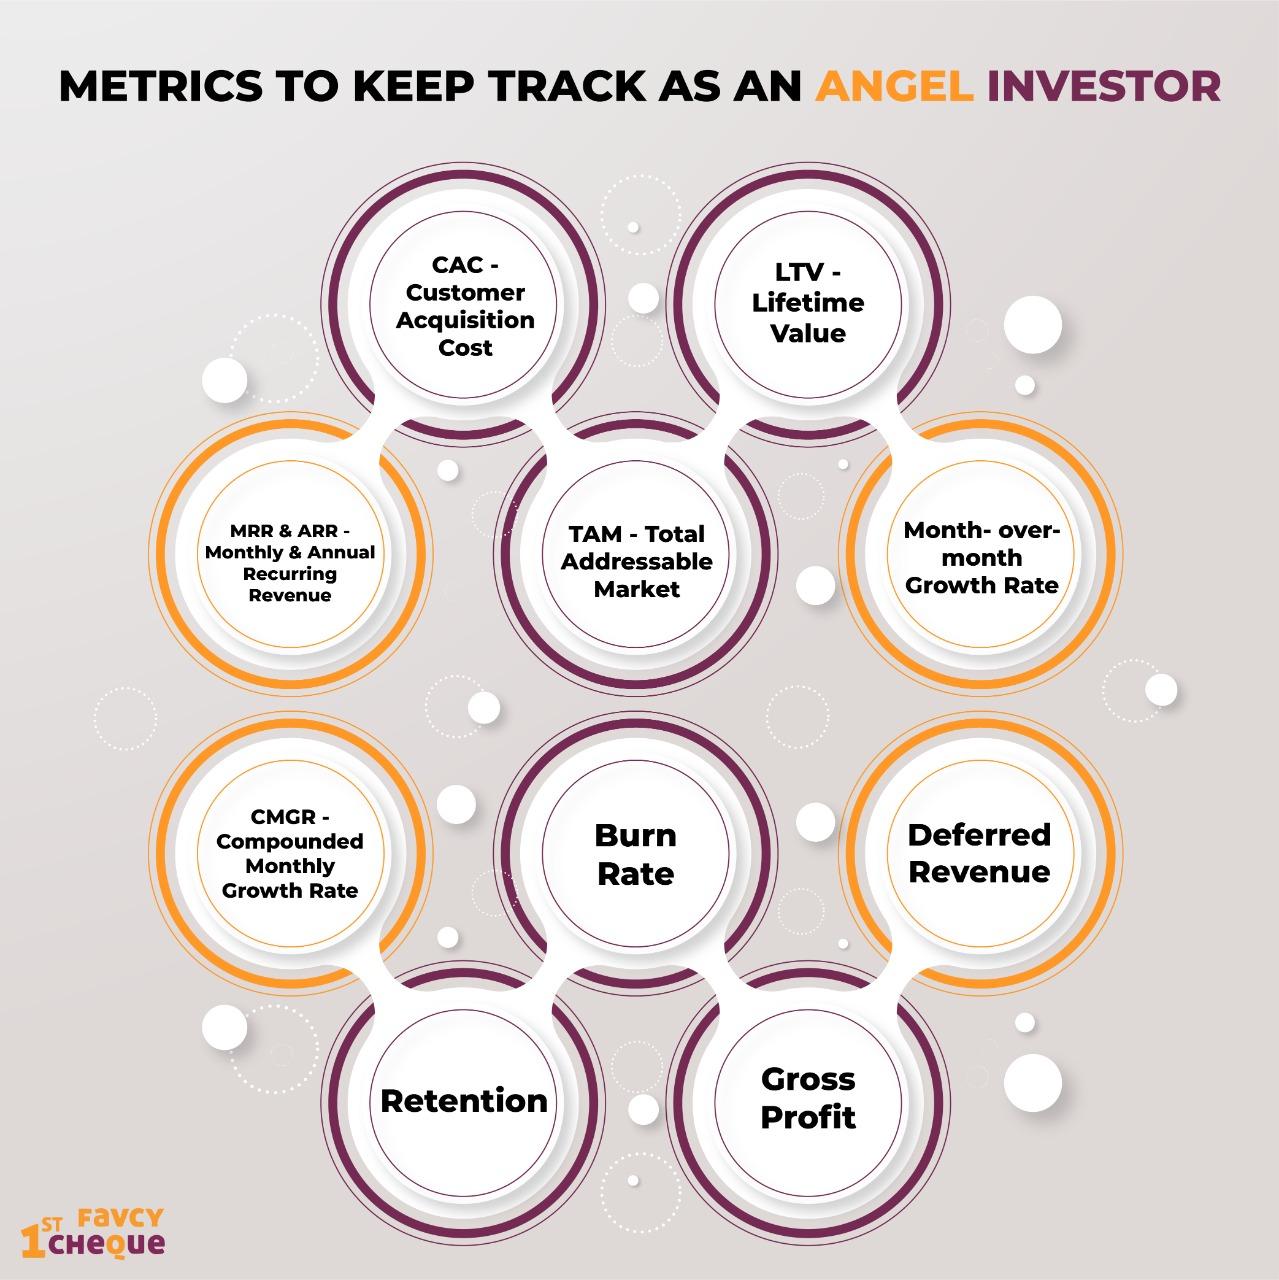
- CAC - Customer Acquisition Cost
- LTV - Lifetime Value
- MRR & ARR - Monthly & Annual Recurring Revenue
- TAM - Total Addressable Market
- Month- over- month Growth Rate
- CMGR - Compounded Monthly Growth Rate
- Burn Rate
- Deferred Revenue
- Retention
- Gross Profit
1. CAC - Customer Acquisition Cost
Basically, the cost of acquiring a new customer. Customer acquisition cost (CAC) is one of the most important growth metrics for an early and growing startup company since customers are the ones generating revenue. But getting customers to buy and trust in the product can be a bit expensive and it must be verified if what the startup is spending on getting customers is being or will be profitable soon.
CAC =
Cost of Marketing & Sales During a Period of Time/ Number of Customers Acquired During that Period of Time
2. LTV - Lifetime Value
LTV is an estimate of the average revenue that a customer will generate throughout their lifespan as a customer. This ‘worth’ of a customer can help determine many economic decisions for a company including marketing budget, resources, profitability and forecasting. The formula may differ depending on your business model.
LTV = Lifetime Customer Revenue - Lifetime Customer Cost
3. Recurring Revenue - MRR & ARR
Recurring Revenue or the Monthly Recurring Revenue (MRR) and Annual Recurring Revenue (ARR). This is typically applicable to SaaS enterprise startups or startups with recurring (subscription) revenue models. It reflects the normalized recurring revenue of a startup on an annual or monthly basis. Startups with recurring revenue models will often generate income from subscriptions on a monthly, annual or multi-year basis. Therefore, their investors and potential investors can use MRR or ARR to predict the revenue the startup can expect to generate over a given period.
MRR = No. of Monthly Subscribers x Average Revenue Per User
ARR = MRR x 12
4. TAM - Total Addressable Market
Total Addressable Market refers to the total market demand for a product or service. It’s the most amount of revenue a business can possibly generate by selling their product or service in a specific market.
It can be calculated by using industry data, market reports, and research studies. It can also be calculated using previous sales and pricing data.
5. Month-over-Month Growth Rate
Growth on a M-O-M basis is a common metric measured by most functions of a company, whether it’s finance, product, marketing, or sales.
It is a key metric to measure growth over a period of time.
M-O-M Growth Rate = (Month 2 – Month 1) /Month 1 * 100
6. CMGR - Compounded Monthly Growth Rate
This is the average month-over-month growth over a longer-term duration, typically 6-18 months. This can be used to determine growth in various contexts — for example, growth of users over a period of time or growth in revenue over a period of time. It’s important to note that CMGR provides the average growth over a period even though growth rates may vary between that period.
CMGR =
Measurement in Last Month / Measurement in First Month1/[Last Month – First Month] – 1
7. Burn Rate
Burn Rate refers to the rate at which a startup burns (i.e. uses) their cash reserves. It’s essentially negative cash flow. Monitoring Burn Rate is essential for every early-stage investment as it reflects how much cash is fuelled into operating the startup, and therefore, you can determine how long a startup has left before its cash reserves are completely depleted. This period of time is referred to as the cash runway.
8. Deferred Revenue
When a customer pays upfront for goods or services that the business hasn’t yet provided, this payment is classified as deferred revenue.
Deferred Revenue = Sum of the amounts paid as customer deposits, retainers and other advance payments
9. Retention Rate
Retention Rate is the rate at which a startup retains its customers over a period of time. It acts as feedback for a startup’s product, customer service and pricing as well as the customer’s enthusiasm for the product.
Retention Rate =
((Number of customers at the end of the period) — (Number of newly acquired customers))/Number of customers at the start of the period
10. GPM - Gross Profit Margin
Gross profit margin (GPM) looks at the difference between revenue and cost of goods sold (COGS). If you look at GPM for individual products, it can help you identify high-margin items the startup might want to promote in their marketing efforts. It can also show you if the startup’s COGS are too high.
GPM should remain fairly steady over time. If not, it might mean either expenses or sales (or both) are fluctuating more than they should. There are some exceptions to this, such as in seasonal businesses.
GPM =
(Revenue — Cost of Goods Sold) / Revenue
Too many KPIs? Work S.M.A.R.T
Information overload? Don’t worry. Luckily here at Angel Bytes we are dedicated to simplifying each and every angel investing subject to make your journey easier.
It’s easy to get caught up in considering every metric — but don’t, this is counterproductive. Take the time to identify the business model of the startup you’re investing in and only measure the key metrics that reflect the performance of the startup you invest in.
S.M.A.R.T stands for Specific, Measurable, Actionable, Relevant & Timely
Since KPIs measure strategic objectives, KPIs need to be S.M.A.R.T.
In addition, having a handful of your top key performance indicators tracked in a spreadsheet will help you significantly because you can then have laser-focused attention to what matters most for your next investment.
Happy analysing!